In previous tutorial we code linear regrassion manually, in this tutorial we will use LinearRegression() function from Scikit-Learn library.
Importing required library
import matplotlib.pyplot as plt
import pandas as pd
import seaborn as sns
from sklearn.linear_model import LinearRegression
Loading Data
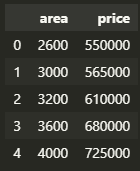
our simple dataset house price. It has two column area and price and we fit a line to this model.
df = pd.read_csv('homeprices.csv')
X = df[['area']].values # convert dataframe to numpy representation. without conversion works but gives warning
#X = pd.DataFrame(df.area) # alternative way to get X
#X = df.iloc[::,0:1:1] # alternative way to get X
#X = df.iloc[:,0] # alternative way to get X
y = df['price'].values # convert numpy representation. without conversion works but gives warning
#y = df.iloc[::,1:2:1] # alternative way to get y
#y = df.iloc[:,1] # alternative way to get y
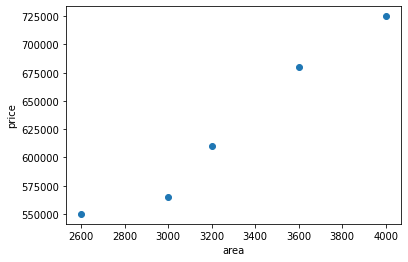
plt.scatter(X,y)
#plt.plot(df['area'],df['price'],'r*') # # alternative way to plot
plt.xlabel('area')
plt.ylabel('price')
Scatter plot will look like
Creating mode and fit
model = LinearRegression()
model.fit(X,y)
Our model is created as a line which is best fit for the data points (min error). Now lets predict some price given house area.
model.predict([[5500]]) # need double index for 2D numpy array
array([927448.63013699])
Model Weight
Now lets see the tangent ‘m’ and intercept ‘c’ for model y = m*x + c
model.coef_
array([135.78767123])
model.intercept_
180616.43835616432
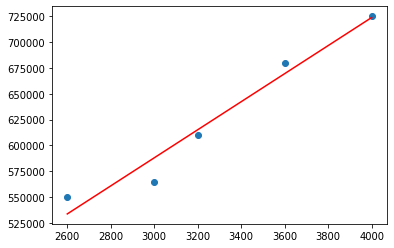
Ploting model line
There are two ways to plot the model line.
plt.scatter(X,y)
plt.plot(X, model.predict(X),'r')
plt.figure()
plt.scatter(X,y)
X1 = list(range(4000))
y1 = []
for x in X1:
    y1.append(model.coef_*x + model.intercept_)

plt.xlim(2000)
plt.ylim(400000)
plt.plot(X1,y1,'r')
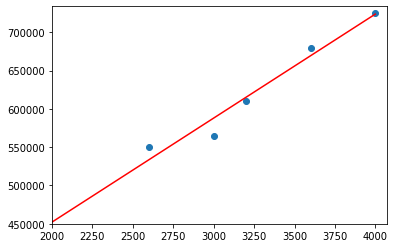
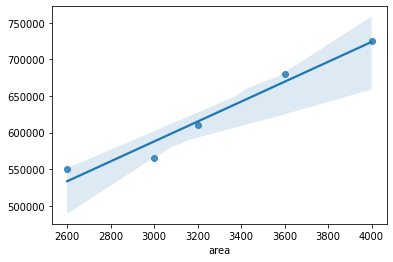
We can plot using regplot function from seaborn library
sns.regplot(data=df,x=X,y=y)